| |

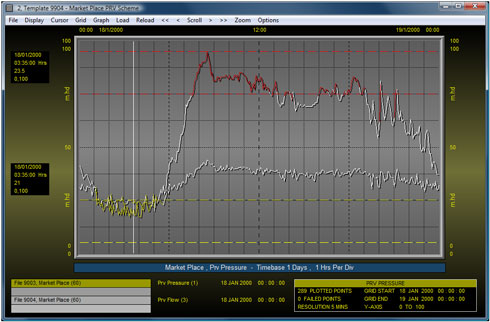
Graph plots may be scrolled forward and backward in time by either the
default timescale or by a user specified period. A graph cursor is available
to examine the plotted data and zoom options are provided to assist your
data analysis.
Useful statistics are presented for the plotted data including the minimum,
average and maximum values, and the percentage of sampled data in the
various alarm categories (high-high, high, normal, low and low-low).
Graph specifications may be configured to depict static
data or to refresh automatically displaying current data. A graph's load
specification gives you full control over the load period, synchronisation,
time offset, data resolution and sampling function (i.e. whether to extract
minimum, maximum, average or integrated totals). Footnotes may be added
to each graph specification or provided by the operator to add useful
comments.
Favourite grid and graph styles can be named and stored within the library;
these styles can be easily applied to other graph specifications to add
consistency to your workstation.
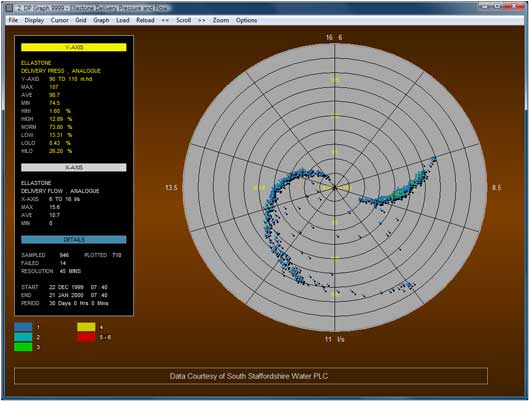
Dual Parameter Graphs
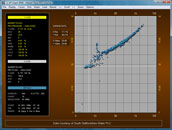
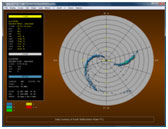 Two point archives may be plotted against each other as a dual-parameter
graph providing a graphical representation of the relationship between
the archives' data. Data may be plotted in either a linear or radial form
using either the conventional plotting formats or various scatter plot
options. Two point archives may be plotted against each other as a dual-parameter
graph providing a graphical representation of the relationship between
the archives' data. Data may be plotted in either a linear or radial form
using either the conventional plotting formats or various scatter plot
options.
Real Time Trace
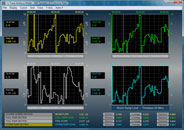 Each workstation can trace up to 16 telemetry points at
resolutions ranging from 1 to 60 seconds. The data is presented in a form
similar to normal graph analysis mode. Up to four traced plots can be
displayed in a single window and updated in real-time. Each workstation can trace up to 16 telemetry points at
resolutions ranging from 1 to 60 seconds. The data is presented in a form
similar to normal graph analysis mode. Up to four traced plots can be
displayed in a single window and updated in real-time.
|