|
 Our
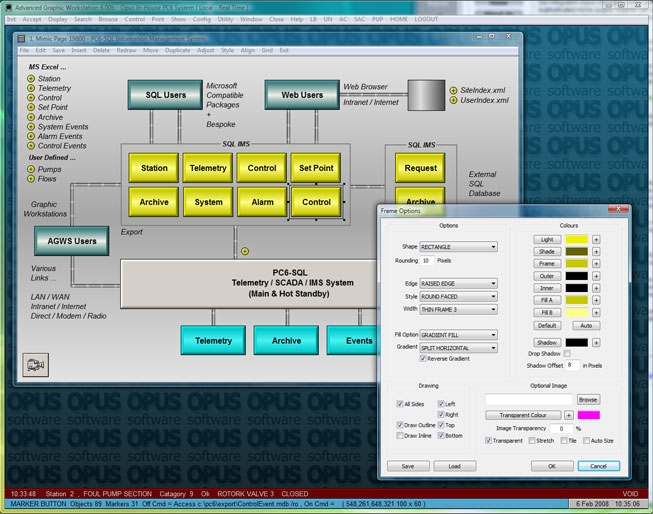
integrated object orientated mimic editor includes many tools enabling
you to quickly create sophisticated mimic pages. Objects can be placed
precisely using different sized 'snap to' grids, and our alignment options
ensure your mimics look neat and professional. Our
integrated object orientated mimic editor includes many tools enabling
you to quickly create sophisticated mimic pages. Objects can be placed
precisely using different sized 'snap to' grids, and our alignment options
ensure your mimics look neat and professional.
Favourite object styles can be named and stored within
the library; these styles can be easily applied to other objects to add
consistency to your displays.
An extensive library of mimic objects such as pumps, tanks
and pipes is supplied to simplify mimic creation. You can also append
your own objects, or object groups, into the library to be used over and
over again. Objects extracted from the library may be pasted using their
original size or resized as appropriate.
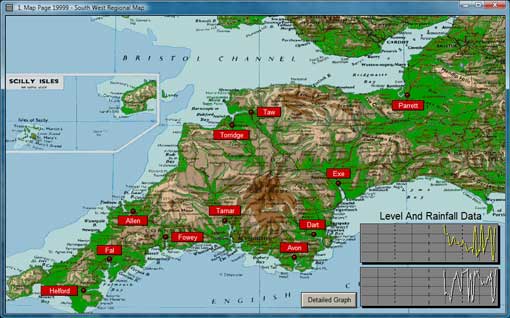
Map Pages
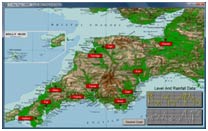 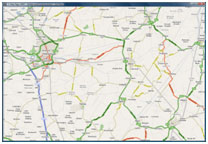 Map pages have the same functionality and capability as
mimics but are intended to render geographical information, floor plans,
maps and charts etc. Map pages have the same functionality and capability as
mimics but are intended to render geographical information, floor plans,
maps and charts etc.
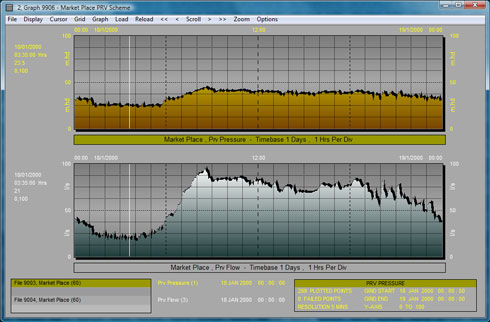
Graph Display and Analysis
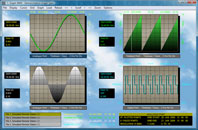 Professional
looking graphs of point archive and time-stamped point archive data can
be created quickly and easily in graph analysis mode. Individual graph
specifications can be named and saved to disk. All graph specifications
can be used as templates to load and display user specified archive data,
usually in response to 'ad hoc' requests by the operator. Professional
looking graphs of point archive and time-stamped point archive data can
be created quickly and easily in graph analysis mode. Individual graph
specifications can be named and saved to disk. All graph specifications
can be used as templates to load and display user specified archive data,
usually in response to 'ad hoc' requests by the operator.
Graph templates can also be inserted on mimic and map pages,
allowing numerous sources of data to be selected with a simple click of
the mouse. A selection of graph templates is provided as standard.
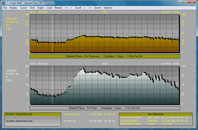 Up
to four graphs may be plotted in a single graph specification, either
superimposed in one or two grids, or displayed individually in separate
grid areas. Up
to four graphs may be plotted in a single graph specification, either
superimposed in one or two grids, or displayed individually in separate
grid areas.
Various graph formats, line styles, fill options, bitmap
and gradient fills are available including segmented colours to depict
alarm boundaries. Various markers can be used to identify the sampled
data points.
Alarm limits may be selected from the configured database
or specified manually. The alarm limits may be plotted on the grid, rendered
on the graph, or a mixture of both.
|