Developers of Telemetry, SCADA & IMS Software
![]()

PSI Proprietary System Interface
| |
Developers of Telemetry, SCADA & IMS Software
|
|
|
PSI Proprietary System Interface |
||
What Is PSI ?The Opus PSI (Proprietary System Interface) is a Microsoft .NET framework software package which provides an interface to third party data. Applications within PSI access and process data sourced from one or more locally or remotely located data based systems (e.g. IMS, Telemetry, SCADA systems etc.). Key Features
PSI ApplicationsStandard PSI applications provide highly sophisticated interfaces to data based systems. The PSI Applications request, process and consume (display or store) data and information provided by the PSI Drivers. Each application is a standalone program that allows the user to request data and information either in an ‘ad hoc’ manner or by using prepared specifications and shortcuts. Where appropriate ‘right click’ options allow the requested data to be transferred and stored in an appropriate form on the operator’s local computer system. Hence, the PSI Apps can be used to confirm, access and store data from the PSI system for subsequent processing using third party packages such as spreadsheets, word processors, report generators etc. The following PSI Applications are currently available,
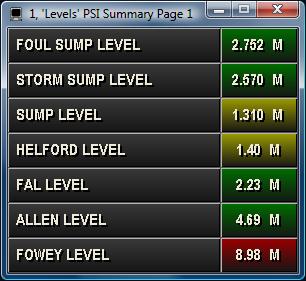
Summary Display PSI App
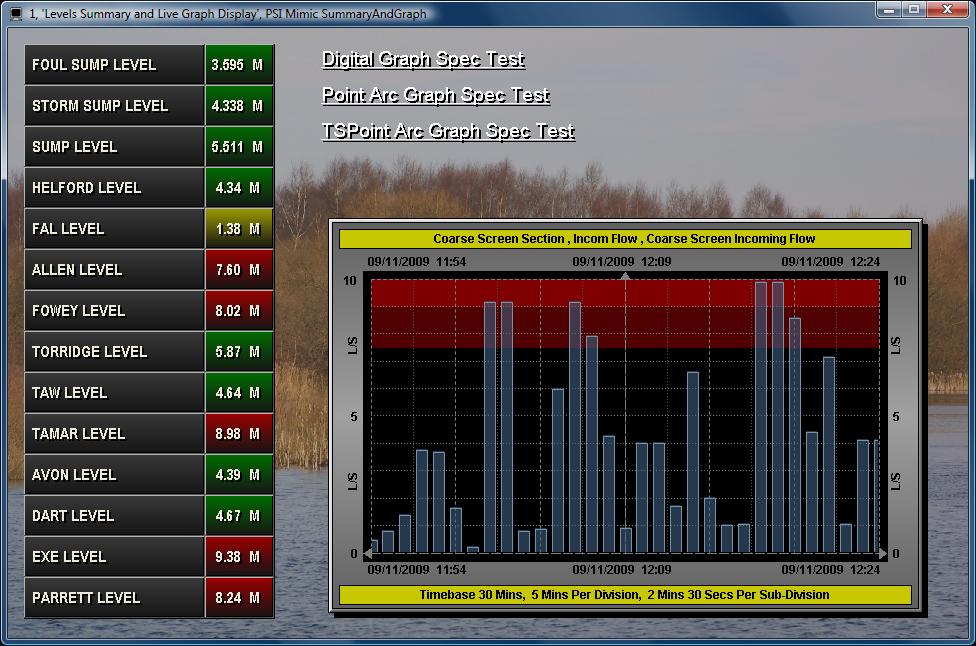
The PSI Summary display application is used to request data and information that is displayed in a summary or data grid format. Each summary can display live or static data. A real-time summary can be restricted to the data of interest by specifying the required search criteria. Options are provided to transfer complete data summaries, stored in a file and format specified by the operator. Graph Display PSI App
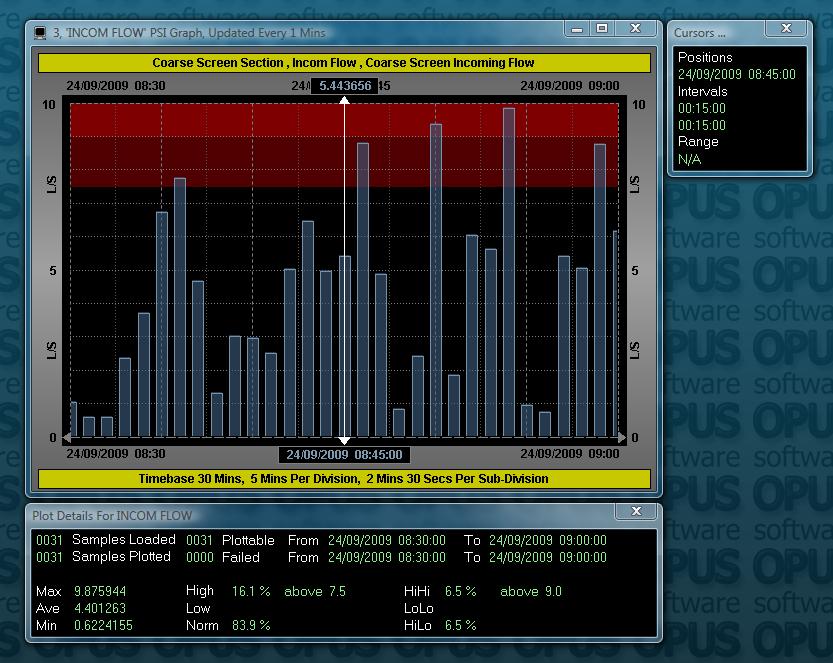
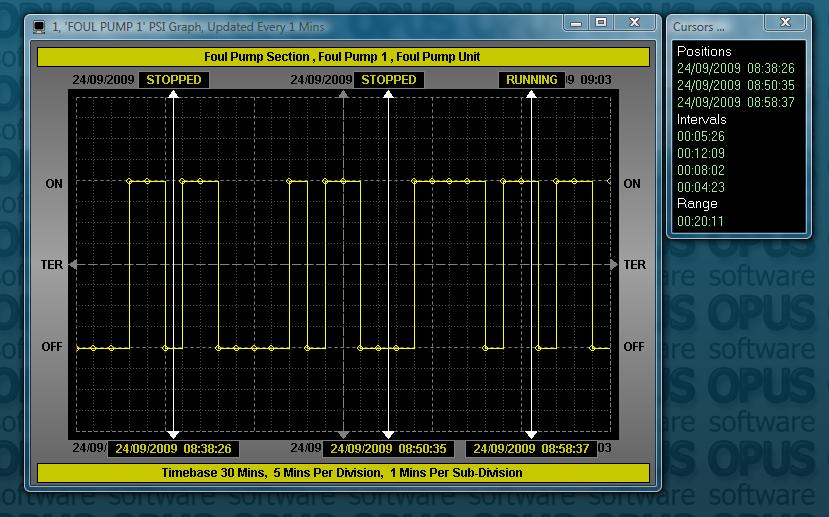
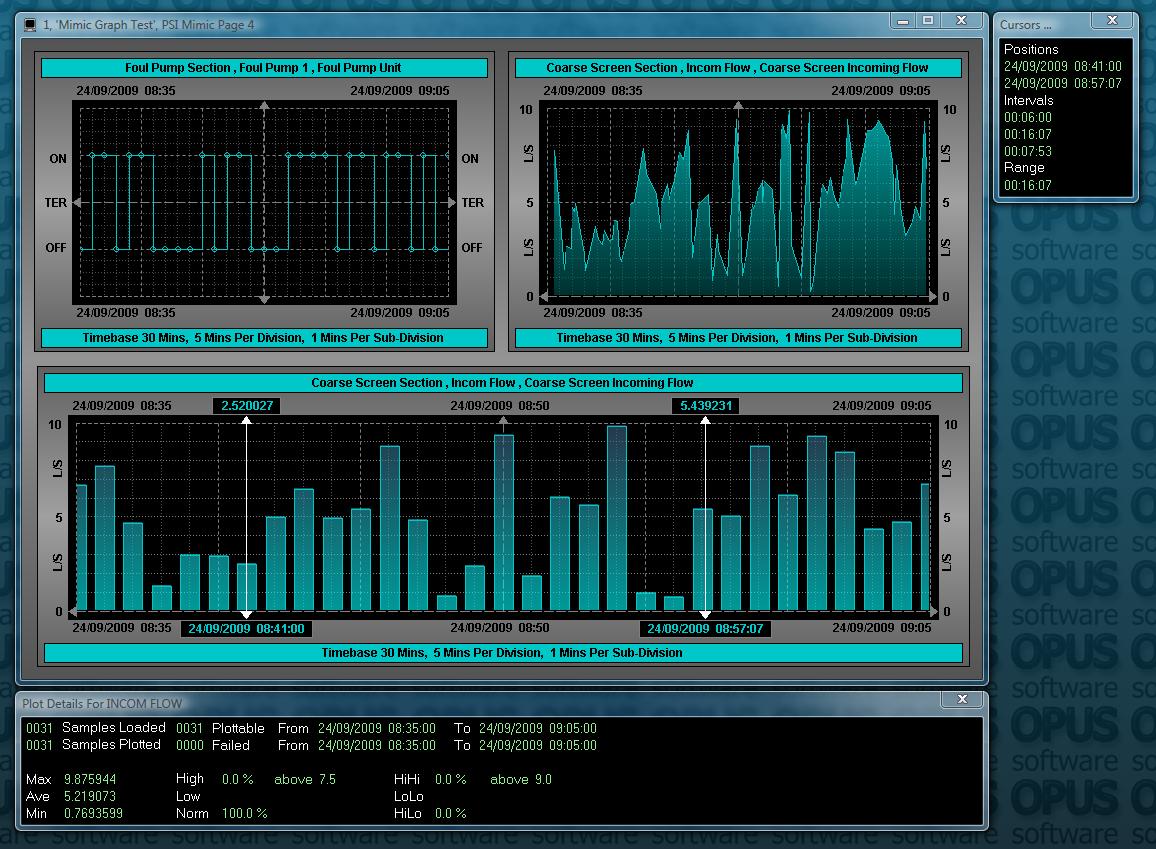
The PSI Graph display application is used to request data and information that is displayed in a graph format. Each graph can display live or static data. Professional looking graphs can be created quickly and easily and then named and saved to disk. Graphs can be used as templates to load and display user specified archive data, usually in response to ‘ad hoc’ requests by the operator. Graphs can also be inserted on mimics. Any
number of graphs may be plotted in a single grid, or displayed
individually in separate grid areas. Various
graph formats, line styles, fill options, bitmap and gradient fills are
available including segmented colours to depict alarm boundaries. Multiple
cursors provide details regarding the cursor positions, intervals and
range within the separate 'Cursor Details' window. Alarm limits may
be selected from the database or specified manually. The alarm limits may
be plotted on the grid, rendered on the graph, or a mixture of both. Graph
plots may be scrolled forward and backward in time by either the default
timescale or by a user specified period. Zoom options are provided to
assist your data analysis. Useful
statistics are presented for the plotted data including the minimum,
average and maximum values, and the percentage of sampled data in the
various alarm categories (high-high, high, normal, low and low-low). Graphs
may be configured to depict static data or to refresh automatically
displaying current data. A graph’s load specification gives you full
control over the load period,
synchronisation, time offset, data resolution and sampling function (i.e.
whether to extract minimum, maximum, average or integrated totals). Options are provided to transfer complete graph
plots, stored in a file and format specified by the operator. Mimic Display PSI App and Editor Package
Mimics are typically used to customise the operator interface or depict information in a graphic or schematic form. Mimics consist of a background superimposed with static, marker, control and live data items. The background can be rendered using either a solid colour, one of the various graduated fills (18 off), or using a specified image (e.g. an associated map, plan or photograph). Various static items can be inserted onto a page
including text, frames (2D or 3D shapes), titled boxes, pipes, tanks, cutout
overlays, bitmap images and icons. Pipes, text frames and bitmaps can be
animated. Markers
can be inserted onto a page and provide operator interaction using simple
mouse clicks. These markers, or mouse hot spots can be inserted using
either hidden points, hidden boxes, or visible mouse buttons. The mouse
cursor automatically changes to a pointing hand symbol whenever the cursor
rolls over a marker. Separate commands can be associated with a marker’s
active and latched states. These commands can be used to provide links to
Microsoft compatible packages (MS Access, MS Excel, Media Player etc.), to
activate utility or user programs (e.g. Visual Basic control
applications), to display other mimics, summaries, and graphs, in fact to
perform any desired action. Live
data can be presented in a wide variety of forms including descriptive
text phrases, analogue and totalised values, bit-mapped colour coded
symbols (of any complexity or size), regular and irregular fills, gauges,
sliders, pipes, data tables and graph plots. Animations can be used to
depict motion, illustrate conditional flow along pipes etc., thereby
bringing your mimics to life. The
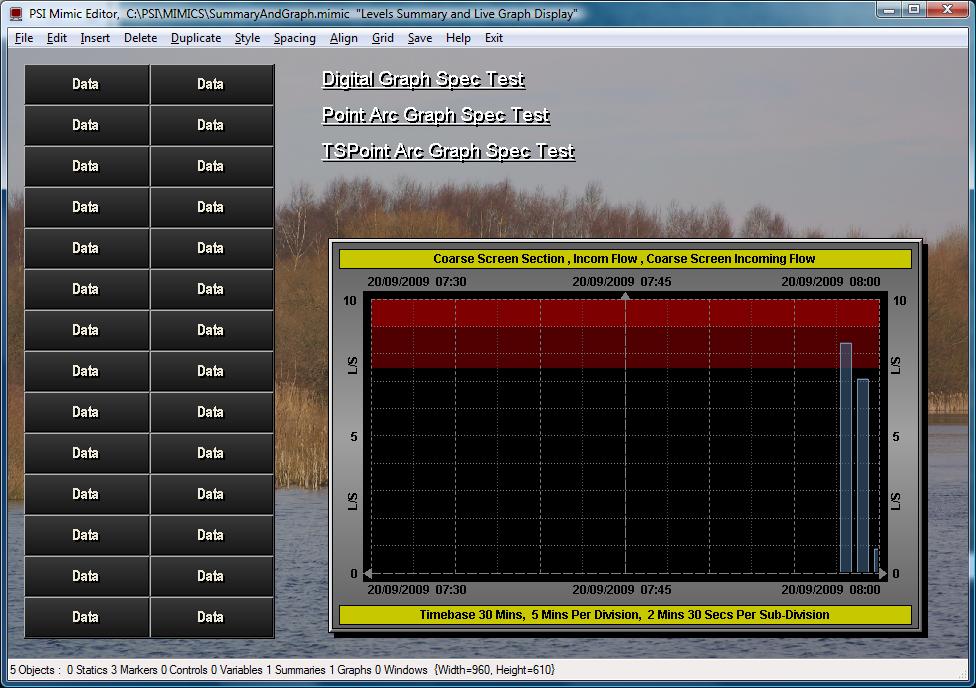
PSI Mimic editor application is used to create and edit the PSI Mimic
pages and includes
many tools enabling you to quickly create sophisticated mimic pages.
Objects can be placed precisely using different sized ‘snap to’ grids,
and our alignment options ensure your mimics look neat and professional. Favourite object styles can be named and stored
within the library; these styles can be easily applied to other objects to
add consistency to your displays. An extensive library of mimic objects is
supplied to simplify mimic creation.
You can also append your own objects, or object groups, into the library
to be used over and over again. Objects extracted from the library may be
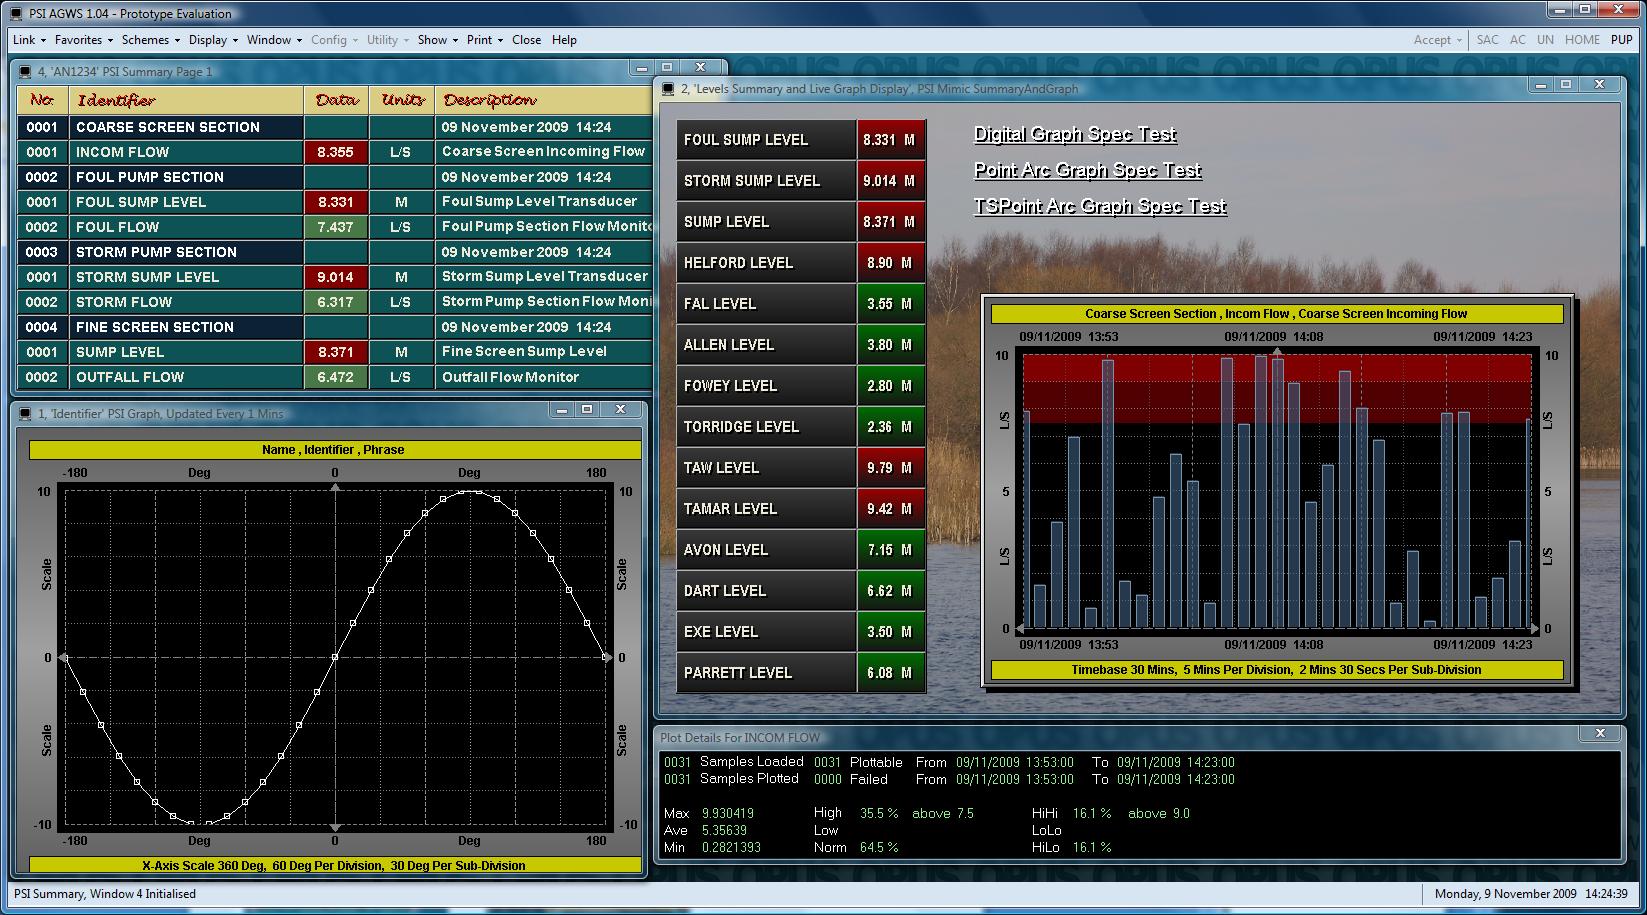
pasted using their original size or resized as appropriate. The AGWS PSI Workstation
The AGWS PSI Workstation incorporates all the display facilities provided by the standalone PSI Applications into a single user interface. The workstation also includes many other features typical of a control room operator’s workstation to provide a sophisticated user interface to the PSI system. The workstation is completely independent of the proprietary systems providing the data and information via the PSI Network. The AGWS PSI Workstation is likely to become our standard user interface on future generations of the Opus Telemetry/SCADA/IMS systems. PSI 'Generic SQL' Database DriverThis driver provides a customisable interface to general SQL database(s). All details relating to the databases, available data summaries, mimic variables, graph data and browse options is specified in an xml definitions file. Monitor Utilities
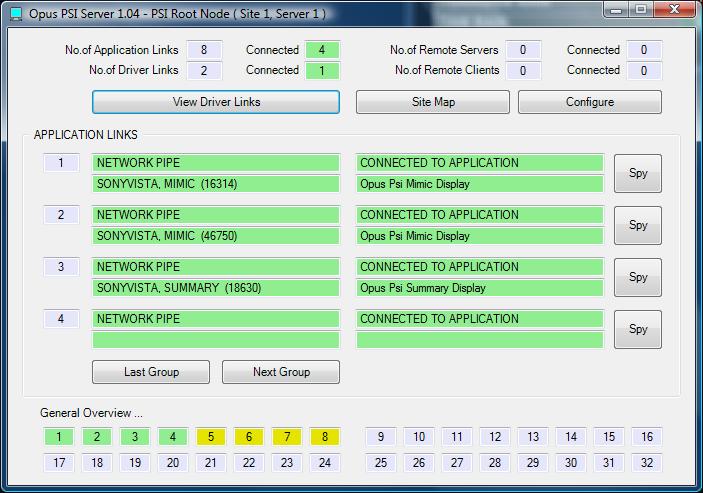
Utilities
are provided to monitor the network links, communications, drivers,
applications and users on the system. Licensing and SupportA user license is required for each driver and every remote client requesting to update the variable data on a displayed summary, graph or mimic page. No user licence is required to edit a mimic page or display a static page on the screen. All software is supplied with one-year software warranty and support. Additional warranty and support can be arranged at the time of purchase or annually. Future DevelopmentsMany future developments are being considered, for example,
A PSI Forms application and workstation interface may be developed to
allow users to request, format, display, and possibly edit data presented
in a user specified form. The PSI Forms will also provide an additional
method to display static and live data. home | about us | products | developers | clients | support | contact us |